








QUINCY — When we talk about a hospital in a community like ours, it’s easy for the conversation to swing between two extremes. Either “everything is great” or “everything is on fire.” Real life is almost never either of those.
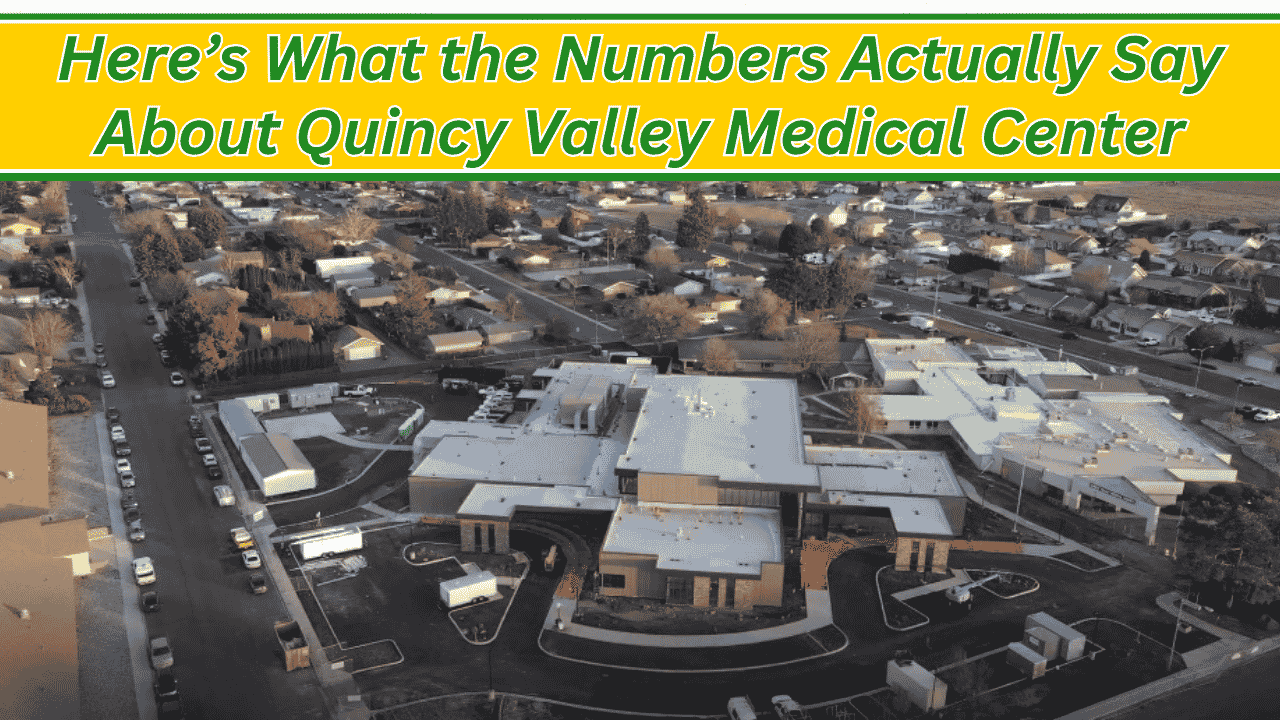
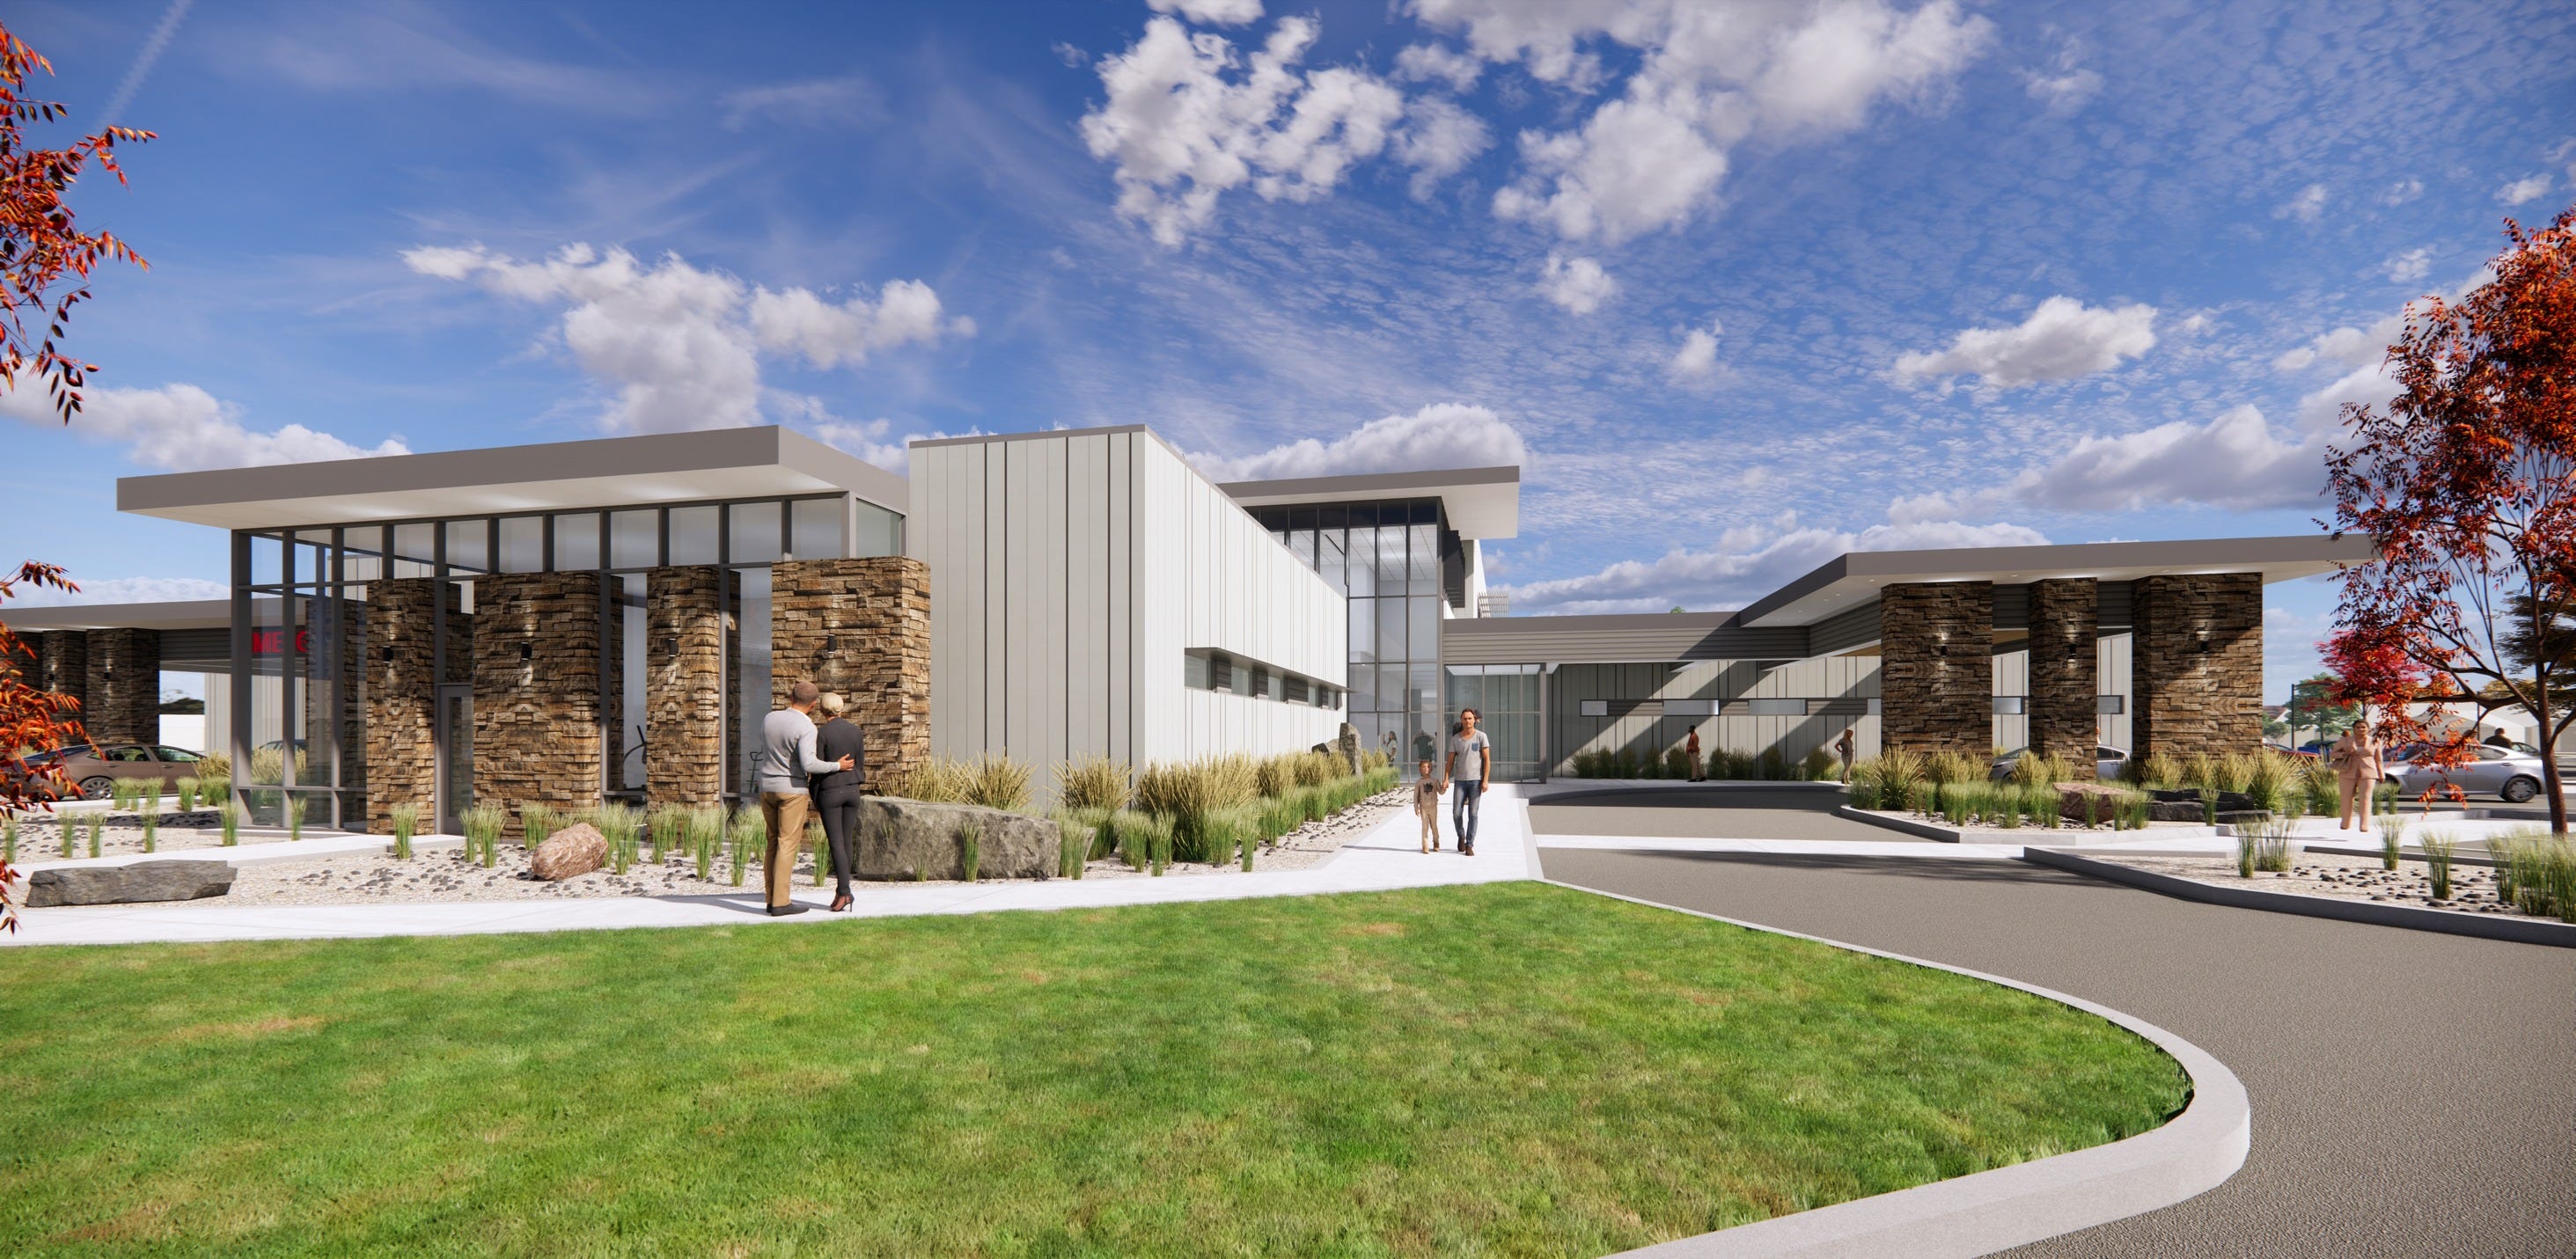
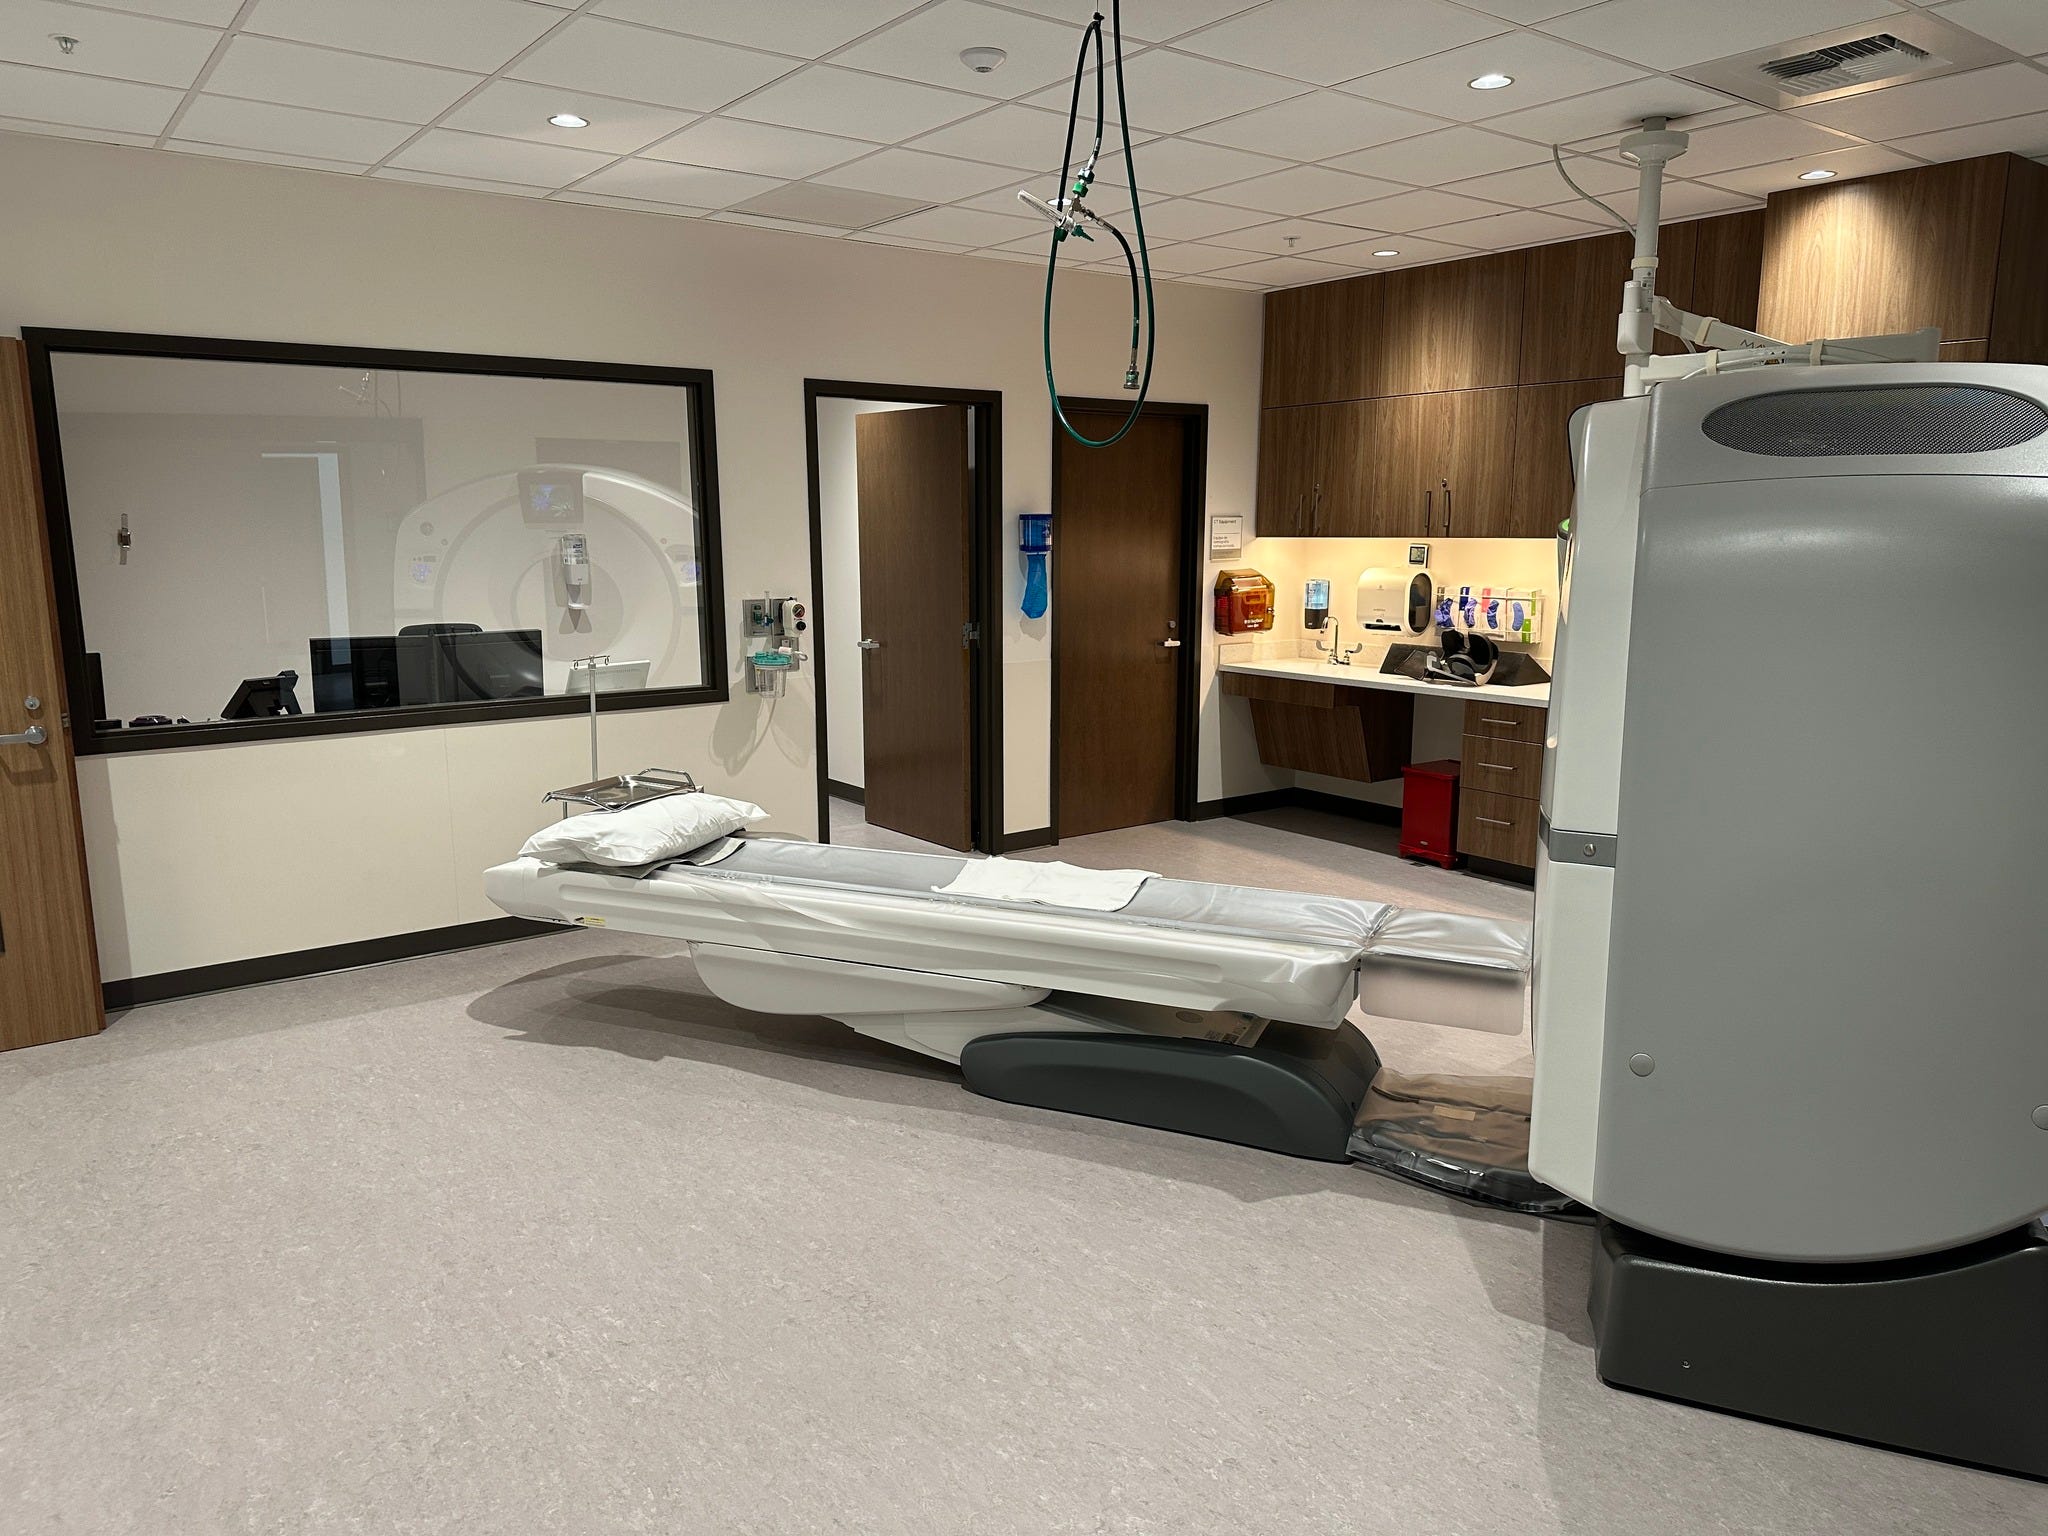
What we got at the latest Quincy Valley Medical Center commissioner meeting was something better than hot takes: a clear look at how the new hospital is functioning, what’s growing, what’s still settling out, and what the numbers actually mean for the people who live here.
This summary is based on the full board packet and the conversation in the room.
The Big Take Aways
The headline: the building is new, but the workload is real
If you want the simplest “is it being used?” answer, it’s this: the workload is showing up in multiple places at the same time—Emergency Department traffic, clinic visits, PT volume, and even dietary and support services.
That matters because in a small town, a hospital doesn’t survive on “pretty.” It survives on steady community use.
Emergency Department: December was strong, January cooled a bit
The board packet spells out ED volume clearly.
December ED census totaled 336, up from November’s 319, and higher than December 2024’s 277. The packet also notes the average daily ED census for December was 10.84, compared to 8.94 in December 2024.
January ED census totaled 305, down from December’s 336. But it was still higher than January 2025’s 269, with an average daily ED census of 9.84 compared to 8.68 in January 2025.
The packet also includes a year-over-year bottom line: 2025 annual ER visits were 4,109 vs. 3,790 in 2024, an 8.4% increase.
What that means for Quincy:
Even when a month dips (like January did from December), the trend line still shows a hospital that’s seeing real traffic. In a rural community, steady ED volume is not a “nice to have.” It’s core infrastructure.
Inpatient care: tiny numbers make big percentage swings
The packet states the hospital had 3 inpatient midnights in December and 0 inpatient midnights in January.
That looks dramatic until you remember how rural critical access works: one or two patients can swing the chart wildly.
What that means for Quincy:
Inpatient “red” on a report doesn’t automatically mean “failure.” It often means, “we’re a small hospital and January didn’t bring the kind of cases that need overnight admission.” The more important question is whether people can get stabilized, treated, and referred appropriately—and the rest of the packet suggests the system is doing a lot of work even when inpatient beds aren’t full.
Observation patients: quiet but important
Observation is the “24 hours or less” category—watching someone to decide if they can go home or should be admitted.
The packet reports 4 observation patients in December and 2 in January.
What that means for Quincy:
Those are the patients who, in another era, might have been transported out “just in case.” Observation capacity is part of what keeps care local.
Clinic and PT: the story isn’t just ER
The HIM pages in the packet include side-by-side monthly tallies for clinic encounters and PT visits across November–January.
Those numbers show exactly what many of us have felt anecdotally: the new facility isn’t just about emergencies. It’s about ongoing care and follow-through.
What that means for Quincy:
A hospital becomes truly valuable when it’s not only the place you go in a crisis, but the place you can get consistent care without losing a day to driving.
The “meals” number everyone should understand
The packet’s Dietary report is one of the clearest proof points that the facility is active day-to-day. It lists meal counts by category and shows the scale of internal volume.
And yes—the meeting conversation about dietary being dramatically higher than last year is supported by what’s in the packet’s utilization data.
What that means for Quincy:
Meals correlate with staff on-site, services running, patients being seen, and family/community presence. It’s not the only metric, but it’s a surprisingly honest one: you don’t feed people at that scale in a building that isn’t being used.
Money leaving the building: the consent agenda amounts in plain English
The packet’s agenda lists the month’s big financial approvals in a way the public can actually read: charity care, accounts sent to collections, amounts collected, accounts payable, and payroll totals.
This is where a lot of community questions live, because people don’t just want “the hospital is doing great.” They want to know: are bills being paid, are services being delivered, and is the organization being transparent?
What that means for Quincy:
These numbers aren’t gossip. They’re a snapshot of the hospital’s obligations and the reality of providing care in a world where reimbursement is slow and complicated.
The “loss” question: why January looks worse on paper than it feels in operations
In the meeting discussion, leadership emphasized a point many people don’t hear explained clearly: depreciation on a brand-new building changes the financial picture on paper even when cash operations are stable. The packet supports that broader context by showing the real operational activity underneath the accounting lines.
What that means for Quincy:
If we only look at a “loss” line without understanding depreciation and reimbursement timing, we’ll scare ourselves unnecessarily. The better question is: is care growing, are operations controlled, and is cash flow being managed through the slow-pay reality of insurance?
Quality and compliance: the boring stuff that keeps you safe
The packet includes Quality Improvement work, task forces, shared leadership efforts, and departmental reporting that is aimed at keeping systems tight—especially around workflow, documentation, and safety.
It also documents the kind of “new building reality” that never makes a ribbon-cutting speech: warranty work, preventive maintenance systems, and the constant pressure of inspections and documentation.
What that means for Quincy:
This is the unglamorous work that protects patients and protects the facility long-term. It’s also the difference between “a nice building” and “a hospital that stays licensed, stays staffed, and stays open.”
Quincy Valley Medical Center By the Numbers
Here’s what the numbers actually say, section by section.
Emergency Department: Still the Front Door
December 2025 ED Visits: 336
December 2024 ED Visits: 272
January 2026 ED Visits: 305
January 2025 ED Visits: 336
2025 Total ED Visits: 4,109
2024 Total ED Visits: 3,790
What it means
December was strong — significantly higher than the previous year. January dipped compared to December, but was still higher than January 2025’s average daily census.
The bigger picture matters more than one month: annual ED visits increased by 8.4% year-over-year.
For a rural hospital, steady or growing ER volume means the facility is serving as a true safety net. People are using it. That’s foundational.
Inpatient (Acute Care): Small Numbers, Big Swings
December Inpatient Midnights: 3
January Inpatient Midnights: 0
What it means
In rural critical access hospitals, inpatient numbers are small. That means one or two patients can dramatically change the percentage.
Zero in January does not mean “no hospital need.” It means January didn’t produce overnight admissions. Stabilization, observation, and outpatient care still occurred.
You judge critical access success differently than you judge large urban hospitals.
Observation Patients: Quiet but Important
December Observation Patients: 4
January Observation Patients: 2
What it means
Observation patients are those monitored for up to 24 hours. These are often people who, years ago, might have been transferred out immediately.
Keeping even a handful of those cases local reduces travel, reduces strain on families, and strengthens local healthcare continuity.
Clinic & PT Visits: The Real Long-Term Indicator
The packet’s HIM report shows clinic encounters and physical therapy visits across the last several months.
Notably:
Physical therapy visits in January increased year-over-year (452 → 497).
What it means
PT growth is a strong sign. Physical therapy represents follow-up care. It means people are coming back. It means recovery is happening locally.
Hospitals don’t survive on emergencies alone. They survive on ongoing services.
The Meal Count: A Surprisingly Honest Metric
The Dietary report shows significant increases in meals served compared to last year.
January total meals were dramatically higher than January 2025.
What it means
Meals correlate with operational activity: staff on site, outpatient services running, patient presence, and internal workflow.
You do not serve that many meals in a building that is underutilized.
It’s one of the clearest quiet indicators that the facility is functioning at a high operational tempo.
Payroll & Accounts Payable: The Monthly Outflow
From the packet:
Accounts Payable Approved: $700,766.75
Payroll Approved: $433,599.52
What it means
Combined monthly outflow sits around $1.13 million before factoring in additional operating expenses.
That aligns with the discussion in the meeting that monthly operational costs run around $1.5 million when fully loaded.
This is not unusual for a facility of this size. What matters is whether revenue trends can support that level long-term.
The “Loss” Line: What It Actually Reflects
January showed a net loss around $200,000 in discussion.
Here’s the key context: the new building carries approximately $200,000 per month in depreciation.
Depreciation is an accounting entry — not cash leaving the bank.
The old building had almost no depreciation left. The new one does.
What it means
If you line up the monthly depreciation expense with the reported loss, you see that operational cash flow and accounting presentation are two different things.
Bills were paid. Staff were paid. Services were delivered.
Accounting changed because the building changed.
Accounts Receivable: The Real Pressure Point
From meeting discussion:
• A/R Days: ~119
• $3.9 million in 91+ day receivables
• ~$200,000 claim in appeal
• L&I credentialing delays blocking billing
What it means
This is the actual stress area.
Healthcare reimbursement is slow. Especially in wound care and infusion services, billing cycles can delay claims 30+ days before they are even submitted.
This is not demand collapse.
This is cash timing.
If A/R improves, the pressure eases significantly.
Staffing: Leaner, Not Bloated
From the HR section:
January 2026 Average FTEs: 51
January 2025 Average FTEs: 56
What it means
The hospital is currently operating with fewer full-time equivalents than last year.
That suggests operational efficiency, not runaway payroll expansion.
Compliance & Quality: The Quiet Backbone
The packet details QI task forces, documentation improvement efforts, shared leadership meetings, and compliance tracking.
Additionally, the hospital passed a three-year accountability audit and a dual Department of Health/CMS survey during this same period.
What it means
Operational discipline appears strong.
That doesn’t generate revenue directly, but it protects licensing, protects reimbursement eligibility, and protects patient safety.
In rural healthcare, compliance failures can end a hospital. Clean audits matter.
So What Does This Mean for Quincy?
Here’s the honest summary:
• Emergency visits are steady and annually growing
• Outpatient and PT services are active and increasing
• Inpatient swings are normal for a hospital this size
• Staffing is leaner than last year
• Monthly operating costs are significant but expected
• Depreciation makes accounting look worse than cash reality
• The primary stress point is reimbursement timing, not patient volume
The hospital is not in crisis.
It is in transition.
New building. New depreciation structure. New service lines. New marketing push. Normal winter seasonal softness.
The real long-term indicators to watch:
• A/R days trend over the next 6 months
• Growth in infusion and specialty services
• Continued outpatient volume strength
• Cash flow stabilization as billing clears
For a small town hospital, stability is success.
The numbers do not show collapse. They show a facility adjusting to its first full operational year in a new building while still serving a steady community demand.
And in rural healthcare, staying steady is not a small achievement.
What We Should Be Watching as a Community
Hospitals don’t succeed or fail overnight. Especially not in rural communities.
If we want to be responsible observers — not alarmists and not cheerleaders — there are a few key indicators worth watching over the next six to twelve months.
First: Accounts Receivable Days.
If A/R days begin trending down from the current ~119 range, that tells us reimbursement is catching up and cash flow pressure is easing. That’s the single most important financial pressure point right now.
Second: Outpatient Growth.
Emergency visits are steady, but the long-term health of a rural hospital increasingly depends on outpatient services — wound care, infusion, physical therapy, clinic encounters. Continued strength there signals sustainable local demand.
Third: Staffing Stability.
The hospital is currently operating leaner than last year. That’s efficient — as long as it doesn’t tip into burnout. Watching retention and hiring trends will tell us whether the workload and staffing levels stay balanced.
Fourth: Consistent Utilization.
Not one strong month. Not one soft month. What matters is consistency. If ED visits, clinic encounters, and support services remain stable across seasons, that’s a strong sign of community reliance.
Fifth: Discipline Behind the Scenes.
Clean audits. Successful inspections. Preventive maintenance. Documentation improvements. These are boring to read about — but they are what keep doors open long-term. Continued operational discipline matters as much as patient volume.
The truth is this: rural hospitals rarely collapse because of one bad month. They struggle when small pressures compound over time.
Right now, the numbers show a facility that is busy, adjusting, and carrying the weight of a new building and modern reimbursement realities.
The question going forward isn’t “Is it perfect?”
It’s “Is it stable and improving?”
That’s the lens we should use as a community.
And based on what we saw in this packet and this meeting, the story is still being written — but it’s not the crisis narrative some might assume.
It’s a hospital in its first full chapter of a new era.
And we’re all stakeholders in how that chapter unfolds.